
|
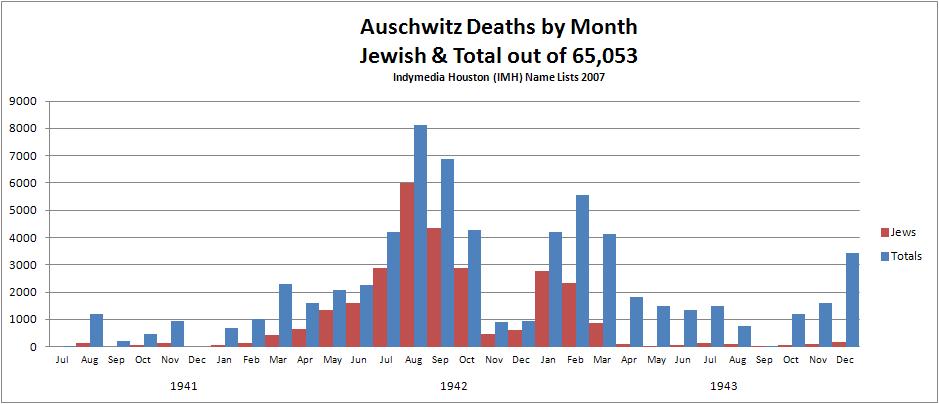
The Successful Endeavour to Reduce Camp Mortality Prelude In the terrible month of August 1942, thirty percent of the Auschwitz male camp population died. A year later, that catastrophic level had been successfully reduced to only one-tenth as much: so that a mere 3% of the camp died in August 1943. It will here be argued that that initial mortality was caused by typhus hitting the camp – to a degree far worse than any other German labour-camp – and that the subsequent drop was due to a successful implementation of hygiene technology and so-called ‘special treatment’ protocols. We here aim to establish that several quite independent databases are coherent and compatible. It will help to have read the previous article which evaluated the British-intelligence monthly decrypts data, comparing their figures with the Auschwitz Death-Books,[1]and showing that they were in accord. We here additionally include a Nuremberg document which gave statistics on mortality through the German labour-camps over twelve months 1942-3, and does so in terms of percent monthly mortality, as alluded to above. By showing that these various databases are interlocking and compatible, we will in some degree discredit the Jewish ‘database in the sky’ concept, whereby it is averred that hundreds of thousands if not millions, of Jews arrived, were not registered but were gassed upon arrival, and then their ashes thrown into the Vistula – so no trace of them remains. A prudent use of Occam ’s razor is here required. The British wartime decryptions made at Bletchley Park give us the key to an authentic arithmetic. ..................... We saw earlier how the massive peak in mortality happened at Auschwitz in 1942 whereas in contrast that in the German camp of Dachau peaked at the war’s end in 1945. Let’s listen to Arthur Butz on this: “the camps in Germany, on the one hand, and the camps in Poland, on the other, play different roles in this study, not only in the sense that the legend claims exterminations only in the latter, but also in the sense of historical fact. From the present point of view, the main difference between the two is that the German camps (e.g. Belsen, Buchenwald, Dachau) experienced catastrophic death rates only at the end of the war, mainly in the first four months of 1945, while the camps in Poland (e.g. Auschwitz, Majdanek) experienced them much earlier, in 1942.’ The Nuremberg document (a letter by Pohl, 4.9.43) evaluated monthly deaths as a percentage of the total inmates each month. For all camps, it divided total deaths by an average of the monthly total population. The lower (blue) graph shows this % figure as given at Nuremberg (the Table at the end shows the actual figures on which it is based). That overall camp monthly mortality from Nazi documents presented at the Nuremberg court,[2] recorded a total of 224,000 inmates in all of the 16 German labour-camps it included, for August 1943. The higher graph shows my attempt to do something similar just for the Auschwitz camp, which was the biggest of all the labour-camps; the previous essay described how the awful peak of thirty percent mortality in August 1942 plummeted downward in Autumn and winter, as the ‘special treatment’ protocols started to take effect. A secondary typhus outbreak then struck in January-February 1943 and once more a total camp lockdown took place.[3] The monthly averages of total camp inmates each month come from the British intel-decrypts, while the corresponding monthly deaths are counted from the Death Books of Auschwitz. We saw in the previous article how these both described the same group. Dividing one by the other gives the percentage. 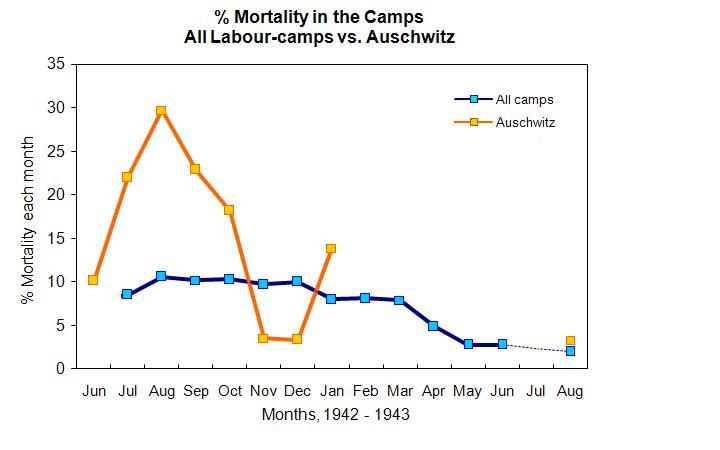 The Nuremberg document also gave us the respective monthly-death figures of Auschwitz in August 1943 as 3.0% for the men’s camp and 3.6% for the women’s camp -compared to the overall for all camps which came to 2.09 %, see graph. In that month of August 1943 the camps of Auschwitz and Birkenau (two miles apart) had 48,000 men and 26,000 women. That represents a huge increase in population from only seven months earlier, January 1943, when it had 25,449 men and 6,631 women. It is quite remarkable that, despite that increase, the % mortality has plummeted in that same period from 15% in January to just over 3% in August 1943. Decrees from this time suggest that this massive and continuous drop in mortality was due to the ‘Special Treatment’ protocols coming into effect to curb the devastating epidemics: December 16, 1942: “Efforts absolutely must be taken to reduce the death rate in the concentration camps by improving the nutrition and, whenever possible and necessary, the working conditions. The camp commandants are to be held personally responsible for this." – SS Chief Himmler December 28, 1942: “The senior camp medical doctors will use all the means at their disposal to insure that mortality rates in the several camps decrease substantially. The camp medical doctors should supervise the nutrition of the prisoners more closely than before and submit proposals for improvements in conformance with the administrative measures of the camp commanders… The Reichsfuhrer SS has ordered that mortality absolutely must be reduced”.- SS officer Richard Glucks. How was this done? ‘[A]lthough in the month of December the mortality rate was still 10%,in January ’43 already it fell to 8% and continued to fall. This reduction in the mortality rate is due primarily to the fact that the hygienic measures which have long been demanded have now been carried out, at least to a large extent. Furthermore it has been ordered in the field of nutrition that one-third of the food raw and properly chopped be added, shortly before distribution, to the cooked food.’ Cooking too long has been avoided. Supplementary ration of sauerkraut and similar foods have been issued. In regard to clothing, it has been ordered that the prisoners may keep their coats on in the winter, insofar as their work permits. Unnecessary prolongation of roll-calls has also been avoided… In the first half of 1943 the death rate averaged 6% while in August 1943 it was only 2%, the letter said. (letter from Pohl, 4.10.43) A reply to Pohl’s report of 30 September 1943 congratulated him on the result achieved, and expressed the hope that improved sanitation and sewerage would yet further reduce the mortality. A new role for the camps as industrial centres was being developed: October 26, 1943: In the framework of German armaments production, thanks to the improvement efforts that have been undertaken in the past 2 years, the concentration camps have become of decisive importance in the war. From nothing we have built armaments works that are second to none. We now have to redouble our efforts to make sure that the production levels so far achieved are not only maintained, but further improved. That will be possible, as long as the works and factories remain intact, only by maintaining and even improving the labor capacity of the prisoners. In earlier years, given the re-educational policy of the time, it did not matter much whether or not a prisoner could perform useful work. Now, however, the labor capacity of the prisoners is important, and all measures of the commanders, director of the liaison service and medical doctors should be extended to maintaining the health and efficiency of the prisoners. – notice by Oswald Pohl[4] The British-intel decrypts surely offer the best possible perspective on this great endeavour, to obtain useful industrial labour from the camps, in 1942-43. The elimination of epidemic diseases from the camp was essential for this endeavour to succeed. The graph shows us how Auschwitz had, over 1942-43, a far higher % mortality than the other camps. Many books by former inmates of Auschwitz have been published, emphasising the hellish conditions there. These statistics help us to appreciate the true horror of what the camp doctor Paul Kremer called ‘this Auschwitz hell:’[5] where dysentery, typhoid fever and typhus were raging. The ground at Auschwitz was too damp to bury corpses, owing to the two rivers nearby, so rotting dead bodies were lying around – plus people defecating whole time. More Catholics than Jews died? The total number of death-certificates recorded in the Death Books for Auschwitz, came to 68,800 with 29,100 Jewish and 31,800 Roman Catholic. There were quite a lot more Christian deaths than Jewish. The important point about these numbers, is that they are in proportion to the total camp numbers of inmates, and do not suggest any one religious/ethnic group was being targeted. Age-Distribution of Deaths 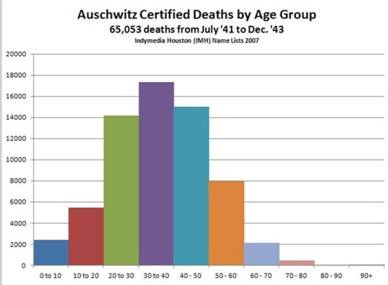 Here is the age-distribution of deaths in the camp. This tends to refute the numerous accounts of children, old folks and those unfit to work being sent ‘straight to the gas-chamber,’ because it shows a quite normal distribution of deaths, peaking around the age of 40. It is not compatible with the traditional concept of an extermination camp. There are some very old people, 80-90 years, in this distribution. The huge database of Bad-Arolsen in North Germany has also been recording all deaths in the German labour-camps, over the last sixty years. The database, built up by the International Red Cross, is nowadays called the International Tracing Service. It’s in some degree independent of the Death Books, because these were kept hidden in Russia until 1989. But it seems to have somewhat comparable numbers of labour-camp deaths recorded: both data-sources imply a comparable number of around thirty thousand Jewish deaths. Both have in common, of recording not one single death by gassing.[6]
Italic: single-day totals, where no monthly means were available. .............................................................. Number Sources: * F.Piper ( in his Auschwitz How Many Perished?, Jews, Poles and Gypsies, 1996, p.4,[1].) gave total Auschwitz inmates as 23070 for 1st June '42. That gives us a June figure (implying 8882 women, as there were then 14188 mean. * Carlo Mattogno Special Treatment p.65, cites Stärkebuch, analysis by Jan Sehn, states: ' In the month of July, 4,401 prisoners died, 4,124 of them in the men’s camp alone...' The men's camp in July had an average of 18,756 inmates, giving a 22% mortality. N.K., March 2013 [1] The Death-Books of Auschwitz, Vols 1-3, 1995; they are written in Polish, but Vol. 2 has a data-analysis chapter in English. [2]
At the Harvard Nuremberg
site, select the IMT/NMT
symbol PS and type in the number 1469 You should
then arrive at a summary screen and if you click
on the right arrow > next to 7 pages you should
get several pages of the letter with table.
[3] Mattogno
Special
treatment, p.44: February
8, 1943: ‘“... a total quarantine of the camp has
once again been imposed upon the Auschwitz
concentration camp.” This was the second total
lock-down in the history of Auschwitz.’
[5]
See Carlo Mattogno, Special Treatment
at Auschwitz’ p.79, or
pp75-81 for Kremer’s experience of the horror.
[6] ‘Unfortunately,
we cannot reference a single document
listing the death of a detainee due to
gassing by Zyklon B. As a rule, the
Nazis gave other causes of death for
inmates, who perished in the concentration
camps. With kind regards, U Jost, Archival
Manager"– 2.11.06 letter to Mr Mannheim.
|
||||||||||||||||||||||||||||||||||||||||||||||||||||||||||||||||||||||||||||||||||||||||||||||||||||||||||||||||||||||||||||||||||||||||||||||||||||||||||||||||||||||||||||||||||||||||||||||||||||||